
Short answer: Persistency is the share of a flock's peak that it keeps as the weeks go by. A healthy Ghana layer flock loses lay slowly and steadily with age, while a sharp step down points to heat, feed, disease or a handling problem. Measure it weekly with the same method every time, read the slope rather than a single morning, and act on the pattern before the trays go light.
Key takeaways
- Persistency is the share of peak lay a flock keeps, measured week by week.
- A slow, steady decline is ageing. A step or a cliff is a cause you can find and fix.
- Use a seven-day average before you read the curve, never a single morning.
- Holding a few points of lay through the second half of the year is worth more than a higher peak.
- Decide on keeping, culling or moulting from the slope and feed per egg, not from the peak alone.
A peak is one day; persistency is the rest of the year
Your flock hit 91 per cent at week 28. Ten weeks later it is at 82, and you want to know whether that is bad. The honest answer is that a single fall tells you very little. What matters is the slope: how fast the flock is losing lay, whether that speed is normal for its age, and whether something in the house changed on the way down.
Farmers tend to remember the peak because it is the proud number on the wall. The peak matters for the first few months of income, but most of the year's eggs come after it. A flock that peaks at 92 and falls off a cliff by week 50 can produce fewer eggs over the year than one that peaks at 89 and holds its line.
Persistency is the name for holding the line. It is the share of peak that a flock keeps as it ages, and it is the number that decides how many eggs the house sells across twelve months.
Defining persistency in numbers you can calculate
Keep it simple. Take the lay percentage for each week, using a seven-day average so one wet morning does not distort it. Divide by the peak to get the share of peak. Then look at the change from one check to the next. You need only three columns on the sheet.
Here is an illustrative flock with a peak of 92 per cent at week 27.
| Week | Lay per cent (seven-day average) | Change from the previous check | Share of peak |
|---|---|---|---|
| 27 | 92.0 | Peak | 100 per cent |
| 35 | 88.0 | Down 4.0 points over 8 weeks | 95.7 per cent |
| 45 | 84.5 | Down 3.5 points over 10 weeks | 91.8 per cent |
| 55 | 79.8 | Down 4.7 points over 10 weeks | 86.7 per cent |
| 65 | 74.0 | Down 5.8 points over 10 weeks | 80.4 per cent |
Check the arithmetic yourself: 88 divided by 92 is 95.7 per cent, and 74 divided by 92 is 80.4 per cent. The change column is the one to read closely. The weekly drop is about half a point in the middle of the year and grows a little towards the end. That slow increase is the shape to expect from an ageing flock. A sudden change in the step is what you investigate.
How Ghana's seasons bend the curve
Day length near the equator barely changes, so the seasons reach a flock through heat, dust, humidity and the feed and water that go with them. The lay curve in Ghana usually shows its bends in the hot spells and the rainy months, not in the length of the day.
The harmattan brings dust, cold nights and dry air. Lay can soften when birds are chilled at night and when dust gets into the feed and the drinkers. Watch the drinkers and the litter, and read the trays on the morning after a cold night before you assume anything else has gone wrong.
The hot spells before the rains are harder. Heat cuts lay within a day or two, and recovery is slower than the drop. Our heat and egg drop guide covers the housing, water and feeding fixes in detail.
The rains add humidity and disease pressure. A rainy-season dip is often a mix of damp litter, humidity and a disease that arrived with the wet weather. Keep records through each season so you can tell the difference the next year, when the same bend appears on the chart.
What drags the curve down faster than age does
Age sets a gentle slope. Anything that pulls the line down sharply is a cause you can find, so make a list before you blame the birds. These are the usual suspects on Ghanaian farms.
- Heat and water shortage, which cut intake and shell quality together
- A sudden feed change, especially a change of mash brand or a drop in calcium
- Disease that causes a cliff, such as a viral challenge that softens shells and drops lay, which your vet should confirm
- Pecking and stress from overcrowding, or from a new group added to the house
- Power cuts that stop water pumps and disturb the lights, which can hit lay within a day
- Egg-eating and broodiness, which reduce the number of eggs you collect
Each cause leaves a fingerprint in the data. A heat dip looks like a V with a quick recovery. A feed change looks like a step that holds for a week or two and then climbs back, if the new feed is right. A disease cliff is a fast fall that does not recover without a change in the flock. Our egg drop syndrome guide covers one of the diseases that drives a cliff, but only your vet can confirm the cause in your flock.
Reading the slope: smooth decline, step or cliff
Once you have a few weeks of data, plot it. A chart is not essential, but a line makes the shape obvious at a glance. Three shapes matter most.
| Pattern on the chart | Usual cause | What to check first |
|---|---|---|
| Smooth, slow decline, a little steeper each month | Ageing, which is expected | Feed per egg, body condition, and whether the decline stays within your plan |
| Sharp dip that recovers within a week or two | Heat, a short water cut, a feed change or a bad night | Temperature at bird height, the drinkers, and the feed bag used that week |
| Step down that does not recover | A disease, a new group of birds, or a feed or light change that stuck | A vet visit, the vaccination record, and every change made in the last four weeks |
The step that does not recover is the one that costs most. It usually means something happened to the flock, not to the hens individually, and the answer lies in your records rather than in the feed bin.
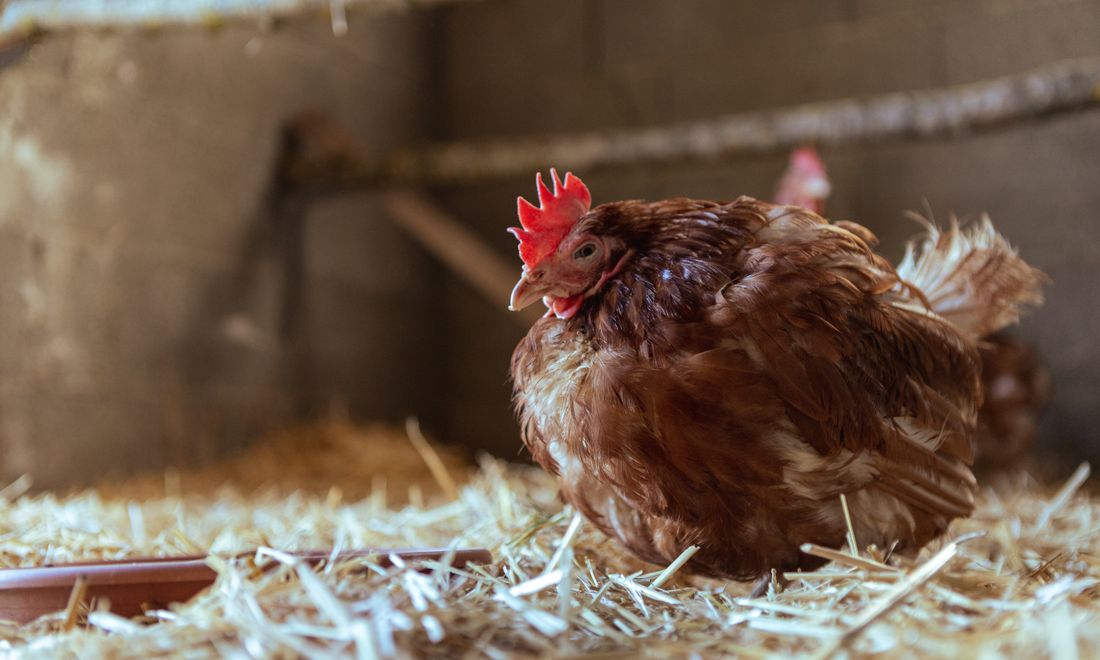
Write the cause beside the step on the chart, even if you are only guessing. In six months the notes will do more to sharpen your judgement than any figure in a book.
What the eggs say while the count falls
Eggs change as hens age. They usually get larger, which is normal, and the shell can become thinner and more fragile. A falling count with bigger eggs and sound shells is ageing. A falling count with small eggs, rough or soft shells, or thin whites points to something else, such as heat, a calcium problem or a viral cause.
Weigh a sample of eggs each month, from the same batch of hens if you can. A simple scale and a note each month tells you whether the average egg is growing as it should. Our egg grading sizes guide covers the sizes buyers expect, which helps you judge whether the eggs are on track for the market.
Check the shells too. Hold an egg to the light, feel the surface for roughness, and count the cracked eggs in the tray. A rise in soft shells during a fall in lay is usually a warning about calcium, heat or disease, and it is worth a vet's look before the count drops further.
A count method that does not lie
The curve is only as honest as the count. Use the same method every day. Collect at the same times, count the trays and the loose eggs at the same hour, and record cracked eggs separately. Do not change the method halfway through, or the curve will tell you about your habits rather than the hens.
Work out the lay percentage by dividing the eggs collected in the day by the number of hens in the house that day, then multiplying by 100. Note the hen numbers carefully. Deaths and culls change the denominator, and a flock that has lost ten hens to disease needs the new count in the calculation, or it will look weaker than it is.
Plot a seven-day rolling average, so one wet Monday or one power-cut Thursday does not dominate the line. Keep the daily numbers beneath it, so that when you look back you can see what caused a dip.
- Same collection times every day
- Cracked and soft eggs counted separately from the good ones
- Hen numbers updated after every death or cull
- Seven-day average plotted once a week
- A note beside any day with a change in feed, light, water or people
Worked example: two flocks with the same peak
The best way to see why persistency matters is to compare two flocks with the same peak. Both reach 92 per cent at week 30. Flock A loses half a point a week after that, while Flock B loses nine-tenths of a point a week. The figures are illustrative, but the gap is the kind a farm sees when a flock is managed well or badly through the second half of the year.
| Week | Flock A, losing half a point a week | Flock B, losing nine-tenths of a point a week | Gap between them |
|---|---|---|---|
| 30 | 92.0 | 92.0 | 0.0 |
| 40 | 87.0 | 83.0 | 4.0 |
| 50 | 82.0 | 74.0 | 8.0 |
| 60 | 77.0 | 65.0 | 12.0 |
Over those 30 weeks Flock A averages about 84.5 per cent lay and Flock B about 78.5 per cent. Across 100 hens that is a gap of around 1,260 eggs, or 42 crates of 30. At 50 cedis a crate, the price used throughout this article, that is about 2,100 cedis of eggs from the same house, the same birds and the same peak. Nobody needs a bigger house to earn that. They need a flock that holds its line.
That is why we talk about persistency before we talk about peak. A flock that loses lay slowly keeps its trays full for longer, and it does so without extra hens. The real curve for your flock depends on its breed, its management and its health, so treat this as a planning example and not a forecast.
Need chicks for your next batch?
Send breed, number and town. We reply with price, hatch date and delivery cost in writing.
What feed can and cannot do for the curve
Feed matters for persistency, but it cannot hold a flock that is being pushed by heat, disease or stress. A flock on the right mash, with clean water, steady calcium and a sensible schedule for feed changes, usually holds its line better than one with a patchy programme. Feed is the foundation, not the cure.
Watch three things: energy and protein for the phase of lay, calcium for shell strength in older hens, and intake on hot days. A flock that eats less in the heat cannot keep its lay up on a feed that is right on paper. Feed earlier and cooler in the day, and keep the bags dry, because damp mash loses both its quality and its appeal. Our layer feeding guide sets out the phases and amounts in more detail.
Be careful with feed changes in the middle of the curve. Changing the brand of mash or the form of feed can cause a dip that looks like disease. If you must change, do it gradually over a week and write the date on the chart, so the dip can be explained later.
Keep, cull or moult: the decisions the curve forces
The curve should drive decisions about the flock. The slope tells you whether to keep the hens to the end of the year, whether to plan a cull, and whether a rest or a molt is worth considering at all. On the figures in our molting example, keeping hens pays while their average lay stays above about half, and the feed per egg stays below what an egg sells for. Start planning replacements when the lay falls below that line, or when the slope turns steep without a clear cause.
Keep records of feed bought, eggs sold and hens housed, and look at feed per egg each month. For the point at which a hen has stopped paying her way, read our culling guide. Before you consider forced moulting at all, read our article on forced molting. The same curve that shows you the decline also shows whether a rest would help, and on most farms it will not.
A monthly plan built on the curve
Set a target for each month before the flock reaches it. Targets turn the curve into a plan, and they tell you early when something has gone wrong. The numbers below are for the flock in our example, and you should replace them with your breed's own targets and your records.
| Months after peak | Target share of peak | What to do in that stretch |
|---|---|---|
| Month 1 | 98 to 100 per cent | Hold feed and water steady, count daily, and avoid any change |
| Months 2 to 4 | 95 to 97 per cent | Check feed per egg and body condition, and reduce waste |
| Months 5 to 8 | 90 to 94 per cent | Review calcium and shells, and write down any cull or replacement plan |
| Months 9 to 12 | Set from your own records | Decide keep, cull or sell, and order the next flock if one is needed |
The targets are not promises. They are the line you draw in advance, so that when the flock falls below it you know the date and the change that came before it. That is the whole point of persistency. Once you can see a drop coming, you can plan around it.
If the next flock is already on your list, our layer day-old chicks page lists the strains we supply, and the order form is there when you are ready. WhatsApp us on +233 24 915 1503 with any question about timing.
Mistakes that make the curve look worse than it is
- Reading one day as a trend. A single bad morning after a storm is not a curve.
- Forgetting to update the hen count. A flock that lost ten hens to disease will look weaker if the sheet still uses the old number.
- Changing the counting method halfway through. The curve then shows your habits, not the birds.
- Blaming age for a step. Age makes a slope, not a cliff, so a cliff needs a cause you can name.
- Comparing with a chart for another breed or climate. Use the breed's figures and your own records, not someone else's peak.
Checklist for the weekly curve review
- Seven-day average updated and plotted.
- Share of peak worked out for the week.
- Slope compared with last week and with the monthly target.
- Hen count updated after deaths and culls.
- Egg weights and shell notes recorded for the week.
- Feed, water, light and staffing changes listed for the same week.
- Any step or cliff reported to the vet, with dates and numbers.
- Next month's target set, and a decision date written in the notebook.
Questions farmers ask
What is persistency in egg laying?
Persistency is the share of its peak lay that a flock keeps as it ages. A flock that peaks at 92 per cent and is at 80 per cent a few months later has a lower persistency than one still at 88. It is measured week by week, and it decides how many eggs the house sells across the whole year, not just at the top of the curve.
What is a good persistency figure for Ghana layers?
There is no single number that fits every breed, house and season. A useful habit is to set a target share of peak for each month of lay, based on the breed's own data and your records, then judge the flock against that target. Use the breed guide as a starting point, and adjust for heat and feed before you decide the flock is underperforming.
How often should I work out the lay percentage?
Every day, with the figure averaged over seven days for the chart. Daily numbers show what happened on a given morning, and the weekly average shows the trend. Keep the method the same for the whole life of the flock, so that the curve compares like with like.
Why did my flock drop after a power cut?
Power cuts stop water pumps, disturb lights and can stop fans in hot weather. Hens that lose water or light for a day or more often lay less within a day or two, and the drop can last a week if the water supply stays unreliable. Keep a backup water supply, and check the drinkers after every outage.
Should I change the feed when the curve starts to fall?
Not straight away. Check the water, the temperature, the disease record and the last month of records first, because a feed change can make a dip worse. If the feed has to change, change it gradually over about a week and write the date down. Changes in the middle of a steep fall make the real cause harder to find.
When should I stop keeping a flock that has passed its best?
Decide that from feed per egg and the lay rate, not from the peak. When the feed cost per egg rises above the price you get for it, and the lay stays below the level that makes keeping the hens worthwhile, it is time to plan a cull and a replacement. Our culling guide sets out the signs to look for.
Can a better persistency make up for a lower peak?
Often, yes. The example in this article shows a flock that peaks a few points lower but holds its line producing more eggs over the year than a higher-peaking flock that falls away. Total eggs across the lay period decide the income, so track the whole curve, not only the top of it.


